Plot chapters over time (multi-timepoint means)
Source:R/plot_chapters_over_time.R
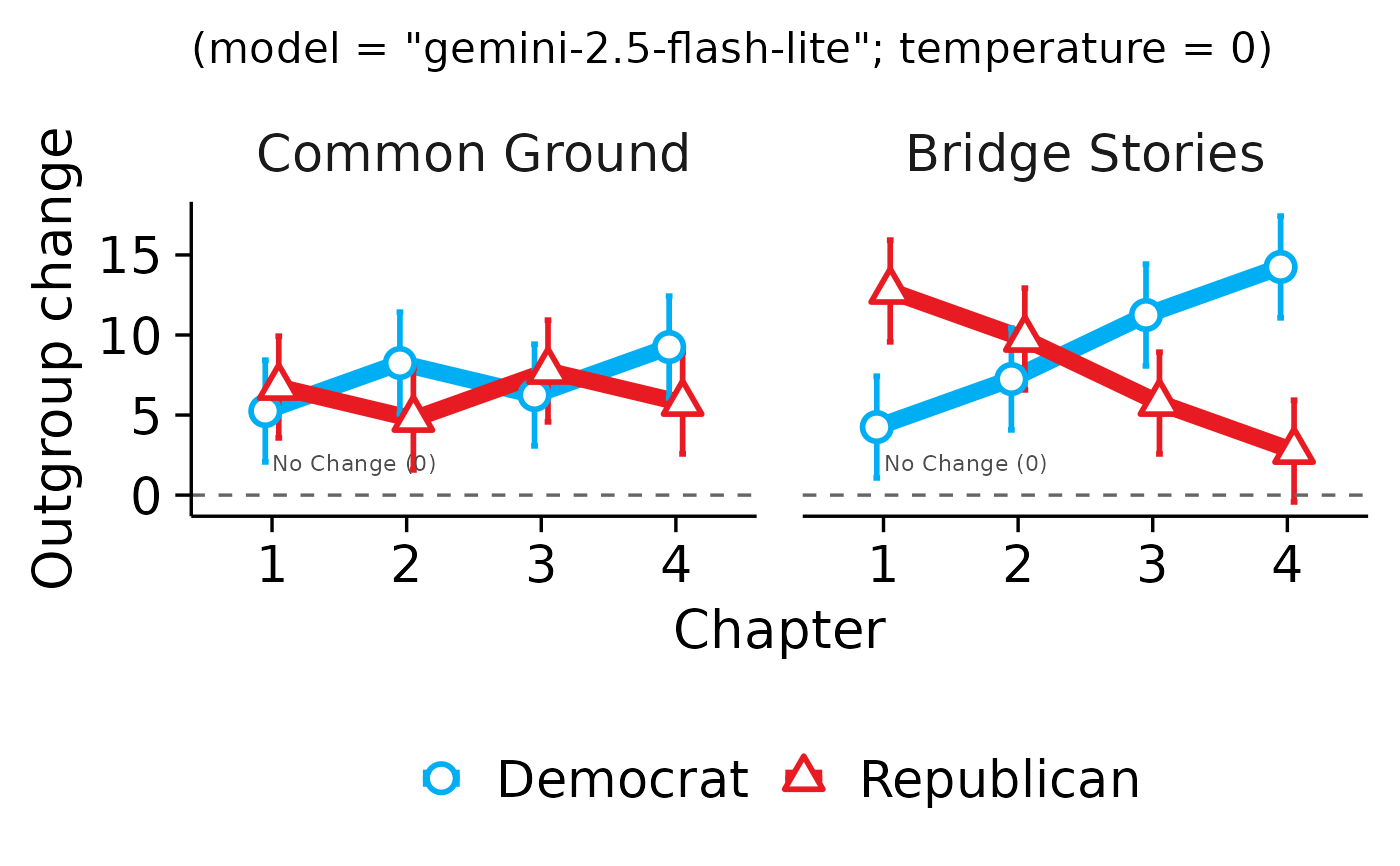
plot_chapters_over_time.RdCreate a plot showing means over chapter timepoints using rempsyc::plot_means_over_time for the wide-format response variables.
Usage
plot_chapters_over_time(
  chapters,
  dv = "delta_gap",
  group = "book",
  x_label = "Chapter",
  y_label = "Simulated scores",
  plot_title = NULL,
  plot_subtitle = "",
  append_model_info = TRUE,
  ci_type = "between",
  legend.position = "bottom",
  groups.order = "decreasing",
  text_size = 20,
  line_width = 3,
  point_size = 4,
  reverse_score = FALSE,
  error_bars = TRUE,
  neutrality_line = TRUE,
  point_images = NULL,
  image_size = 0.04,
  image_nudge_x = 0,
  image_nudge_y = 0,
  image_jitter_width = 0,
  image_jitter_height = 0,
  facet = NULL,
  facet_ncol = NULL,
  facets.order = "increasing"
)
Arguments
- chapters
A data frame or list of processed simulation rows, typically returned by
compute_run_ai_metrics(), containing columnsbook,chapter, and the desireddv. If a list is supplied, the function will attempt to combine its data-frame elements before plotting.- dv
Character. Name of the column to plot as the dependent variable (default: "pre_post_outgroup_difference").
- group
The group by which to plot the variable
- x_label
Character. X-axis label.
- y_label
Character. Y-axis label.
- plot_title
Optional character title. If
NULL(default) orFALSE, no title is added.- plot_subtitle
Optional plot subtitle.
- append_model_info
Logical. If
TRUE(default), append model and temperature attributes to the subtitle (or create one if none is provided).- ci_type
Character. Type of confidence interval to pass to
rempsyc::plot_means_over_time.- legend.position
Position for legend.
- groups.order
Specifies the desired display order of the groups on the legend. Either provide the levels directly, or a string: "increasing" or "decreasing", to order based on the average value of the variable on the y axis, or "string.length", to order from the shortest to the longest string (useful when working with long string names). "Defaults to "decreasing".
- text_size
Numeric. Base text size for axis/title text.
- line_width
Numeric. Line thickness used in
geom_line(). Defaults to 3. Can be reduced for publication figures or increased for presentation slides.- point_size
Numeric. Point size used in
geom_point(). Defaults to 4. Adjust to improve readability depending on output format.- reverse_score
Logical. Whether to reverse score scale.
- error_bars
Logical. Show error bars.
- neutrality_line
Logical. Add a horizontal neutrality line at 50.
- point_images
Optional named list mapping group levels to image file paths (PNG recommended). When supplied, the point markers are replaced with the corresponding images, and the legend labels are updated to show the matching image alongside the group name when
ggtextis installed. Example:list(Democrat = "logos/dem.png", Republican = "logos/rep.png").- image_size
Numeric. Size of images when
point_imagesis used. Passed toggimage::geom_image(). Defaults to0.04.- image_nudge_x
Numeric. Horizontal offset applied to point images only. Defaults to
0.- image_nudge_y
Numeric. Vertical offset applied to point images only. Defaults to
0.- image_jitter_width
Numeric. Horizontal jitter width applied to point images only. Defaults to
0.- image_jitter_height
Numeric. Vertical jitter height applied to point images only. Defaults to
0.- facet
The variable by which to facet grid.
- facet_ncol
Optional numeric value passed to
ggplot2::facet_wrap()asncolwhenfacetis supplied.- facets.order
Specifies the desired display order of facet panels. Either provide the levels directly, or a string: "increasing" or "decreasing", to order panels based on the average value of the y variable, or "string.length" to order panels by facet label length. Defaults to "increasing".