Plot chapter trajectories by book
Source:R/plot_chapter_trajectories.R
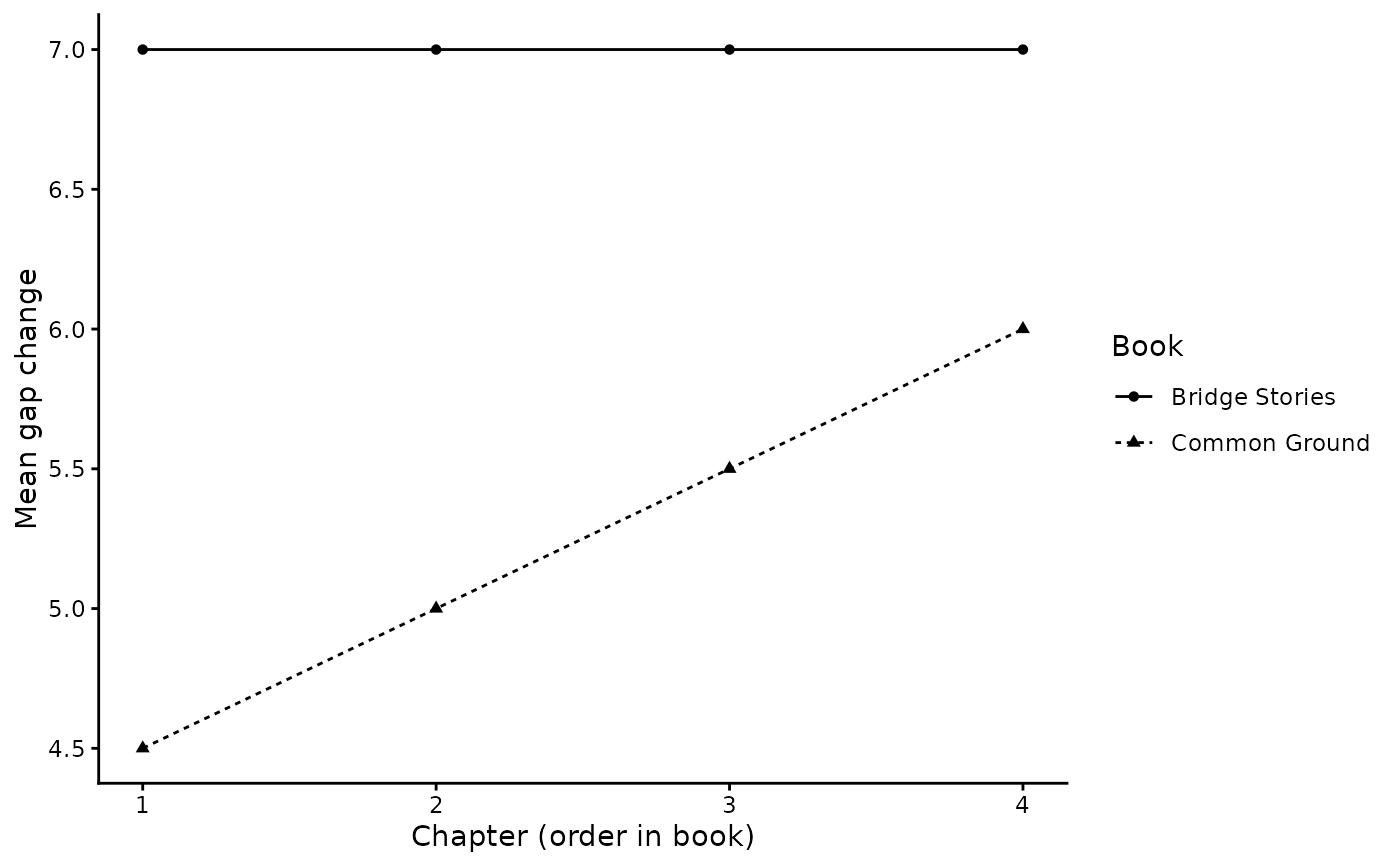
plot_chapter_trajectories.RdSimple line plot of mean simulated outgroup rating across chapter order for each book.
Usage
plot_chapter_trajectories(
  summary_df,
  dv = "mean_post_outgroup",
  y_label = "Simulated scores"
)
Arguments
- summary_df
A data frame produced by
summarize_chapter_scores()with columnschapter_index,mean_post_outgroup, andbook.- dv
Character. Column name to plot on the y-axis. Defaults to
"mean_post_outgroup".- y_label
Character. Y-axis label.
Examples
chapter_summary <- summarize_chapter_scores(toy_sim_results)
plot_chapter_trajectories(
  chapter_summary,
  dv = "mean_delta_gap",
  y_label = "Mean gap change"
)