Faceted plot of chapter scores
Source:R/plot_chapter_scores_faceted.R
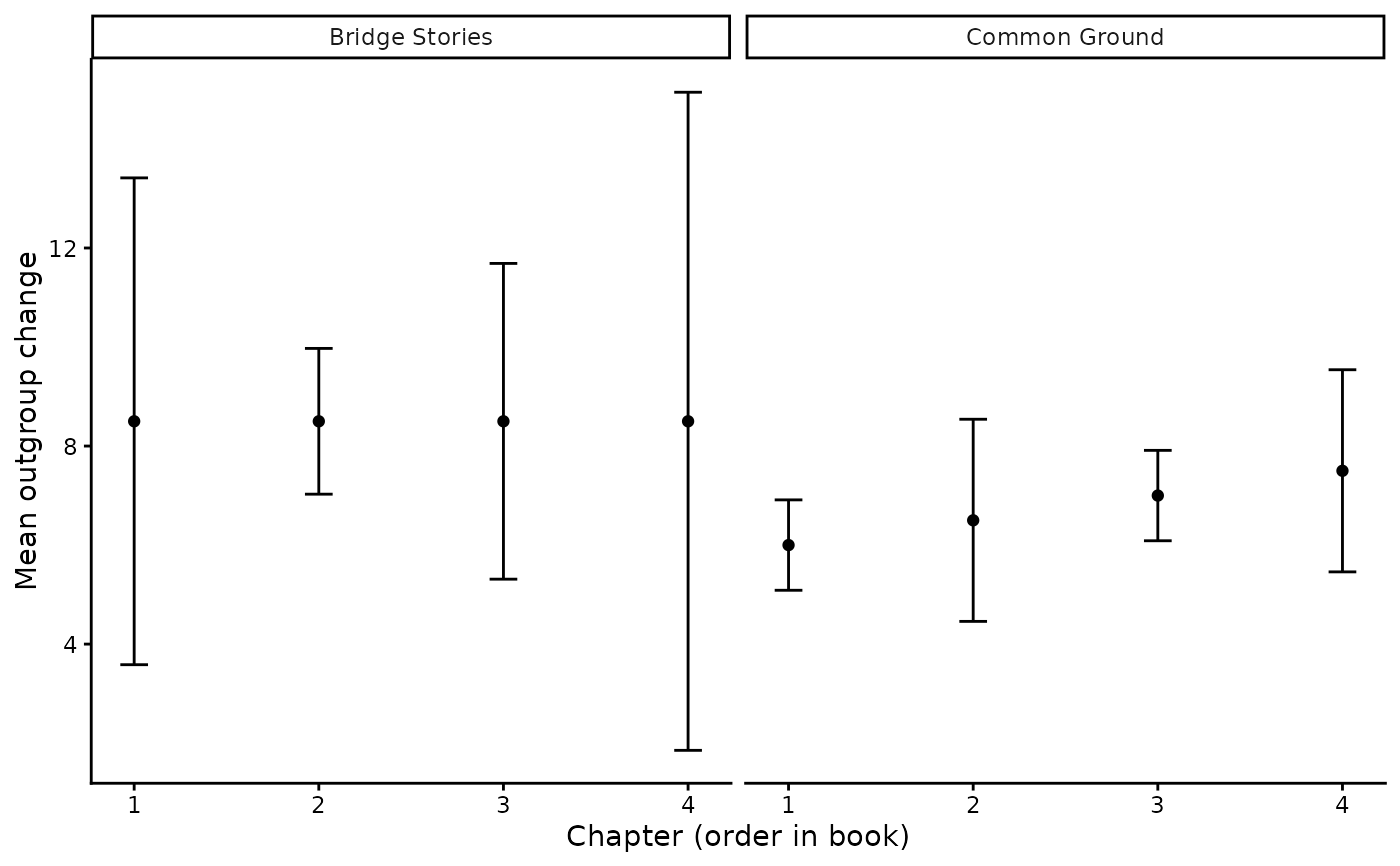
plot_chapter_scores_faceted.RdCreate a faceted plot (one facet per book) showing mean scores and error bars.
Arguments
- summary_df
Data frame produced by
summarize_chapter_scores().- dv
Character. Column name prefix for mean and sd. For example,
"post_outgroup"will plotmean_post_outgroup±sd_post_outgroup.- y_label
Character string for y-axis label.
Examples
chapter_summary <- summarize_chapter_scores(toy_sim_results)
plot_chapter_scores_faceted(
  chapter_summary,
  dv = "delta_outgroup",
  y_label = "Mean outgroup change"
)